Sun & Shadow Position Specialists
Preparing certified shadow diagrams throughout Australia since 2008
Sydney - New South Wales
Melbourne - Victoria
Brisbane - Queensland
Perth - Western Australia
Adelaide - South Australia
Hobart - Tasmania
Darwin - Northern Territory
Canberra - Australian Capital Territory
Professional Affiliations & Trusted Service Provider to Local and State Government Agencies


At ShadowDiagrams.net.au, we are the only firm in the industry providing certified shadow diagrams prepared and endorsed by both a registered architect and an accredited building practitioner. This dual level of professional oversight guarantees compliance with council requirements, reducing the risk of costly delays or rejections. Our diagrams are accepted by all councils and can also be submitted as expert witness reports in the Land and Environment Court.
In recent years, there has been a rise in overseas-based providers and unqualified local operators claiming to offer similar services. Many of these rely solely on drafting experience, without any formal architectural registration or accreditation—placing your project at risk. With councils applying greater scrutiny to documentation, shadow diagrams that fail to meet strict technical standards can compromise your entire planning application.
With over 1,300 projects successfully delivered nationwide, ShadowDiagrams.net.au brings unmatched expertise, an in-depth understanding of planning requirements, and a proven record of accuracy. Our team knows the nuances of local council guidelines and the importance of getting it right the first time.
When precision matters, trust the firm with genuine credentials. Trust ShadowDiagrams.net.au—where your diagrams are prepared by qualified professionals.
What is a shadow diagram?
A shadow diagram, also called a solar access diagram or sun path diagram, is an essential tool in architectural design and urban planning used to visualise the impact of a proposed building on sunlight exposure. These diagrams accurately show the length, direction, and movement of shadows cast by a structure throughout the day and across different seasons. Shadow diagrams allow architects, planners, and stakeholders to assess how new developments may overshadow nearby properties, public spaces, and streets, helping to ensure compliance with solar access regulations and optimise natural light. Typically, diagrams focus on critical times of the year, such as the winter and summer solstices and the equinoxes, highlighting key times like 9 a.m., 12 p.m., and 3 p.m. By illustrating changes in shadow patterns, these diagrams provide valuable insights into potential overshadowing impacts and inform smarter, more sustainable design decisions.
Shadow Diagrams - Animations
Shadow diagrams are an essential tool for architects, urban planners, and designers in Sydney, Melbourne, and across Australia who aim to create buildings that are visually appealing and considerate of their surroundings. In densely populated urban areas, access to natural light is highly valued for its practical and psychological benefits, including improved mood, enhanced energy efficiency, and a higher quality of life for residents. Protecting solar access has become a key aspect of sustainable urban design, and shadow diagrams help identify potential conflicts between new developments and existing properties. By accurately illustrating how proposed buildings may cast shadows on neighbouring structures, public spaces, and streets, these diagrams support smarter planning decisions and ensure compliance with local solar access regulations in New South Wales, Victoria, Queensland, South Australia, Western Australia, Tasmania, and other regions of Australia.

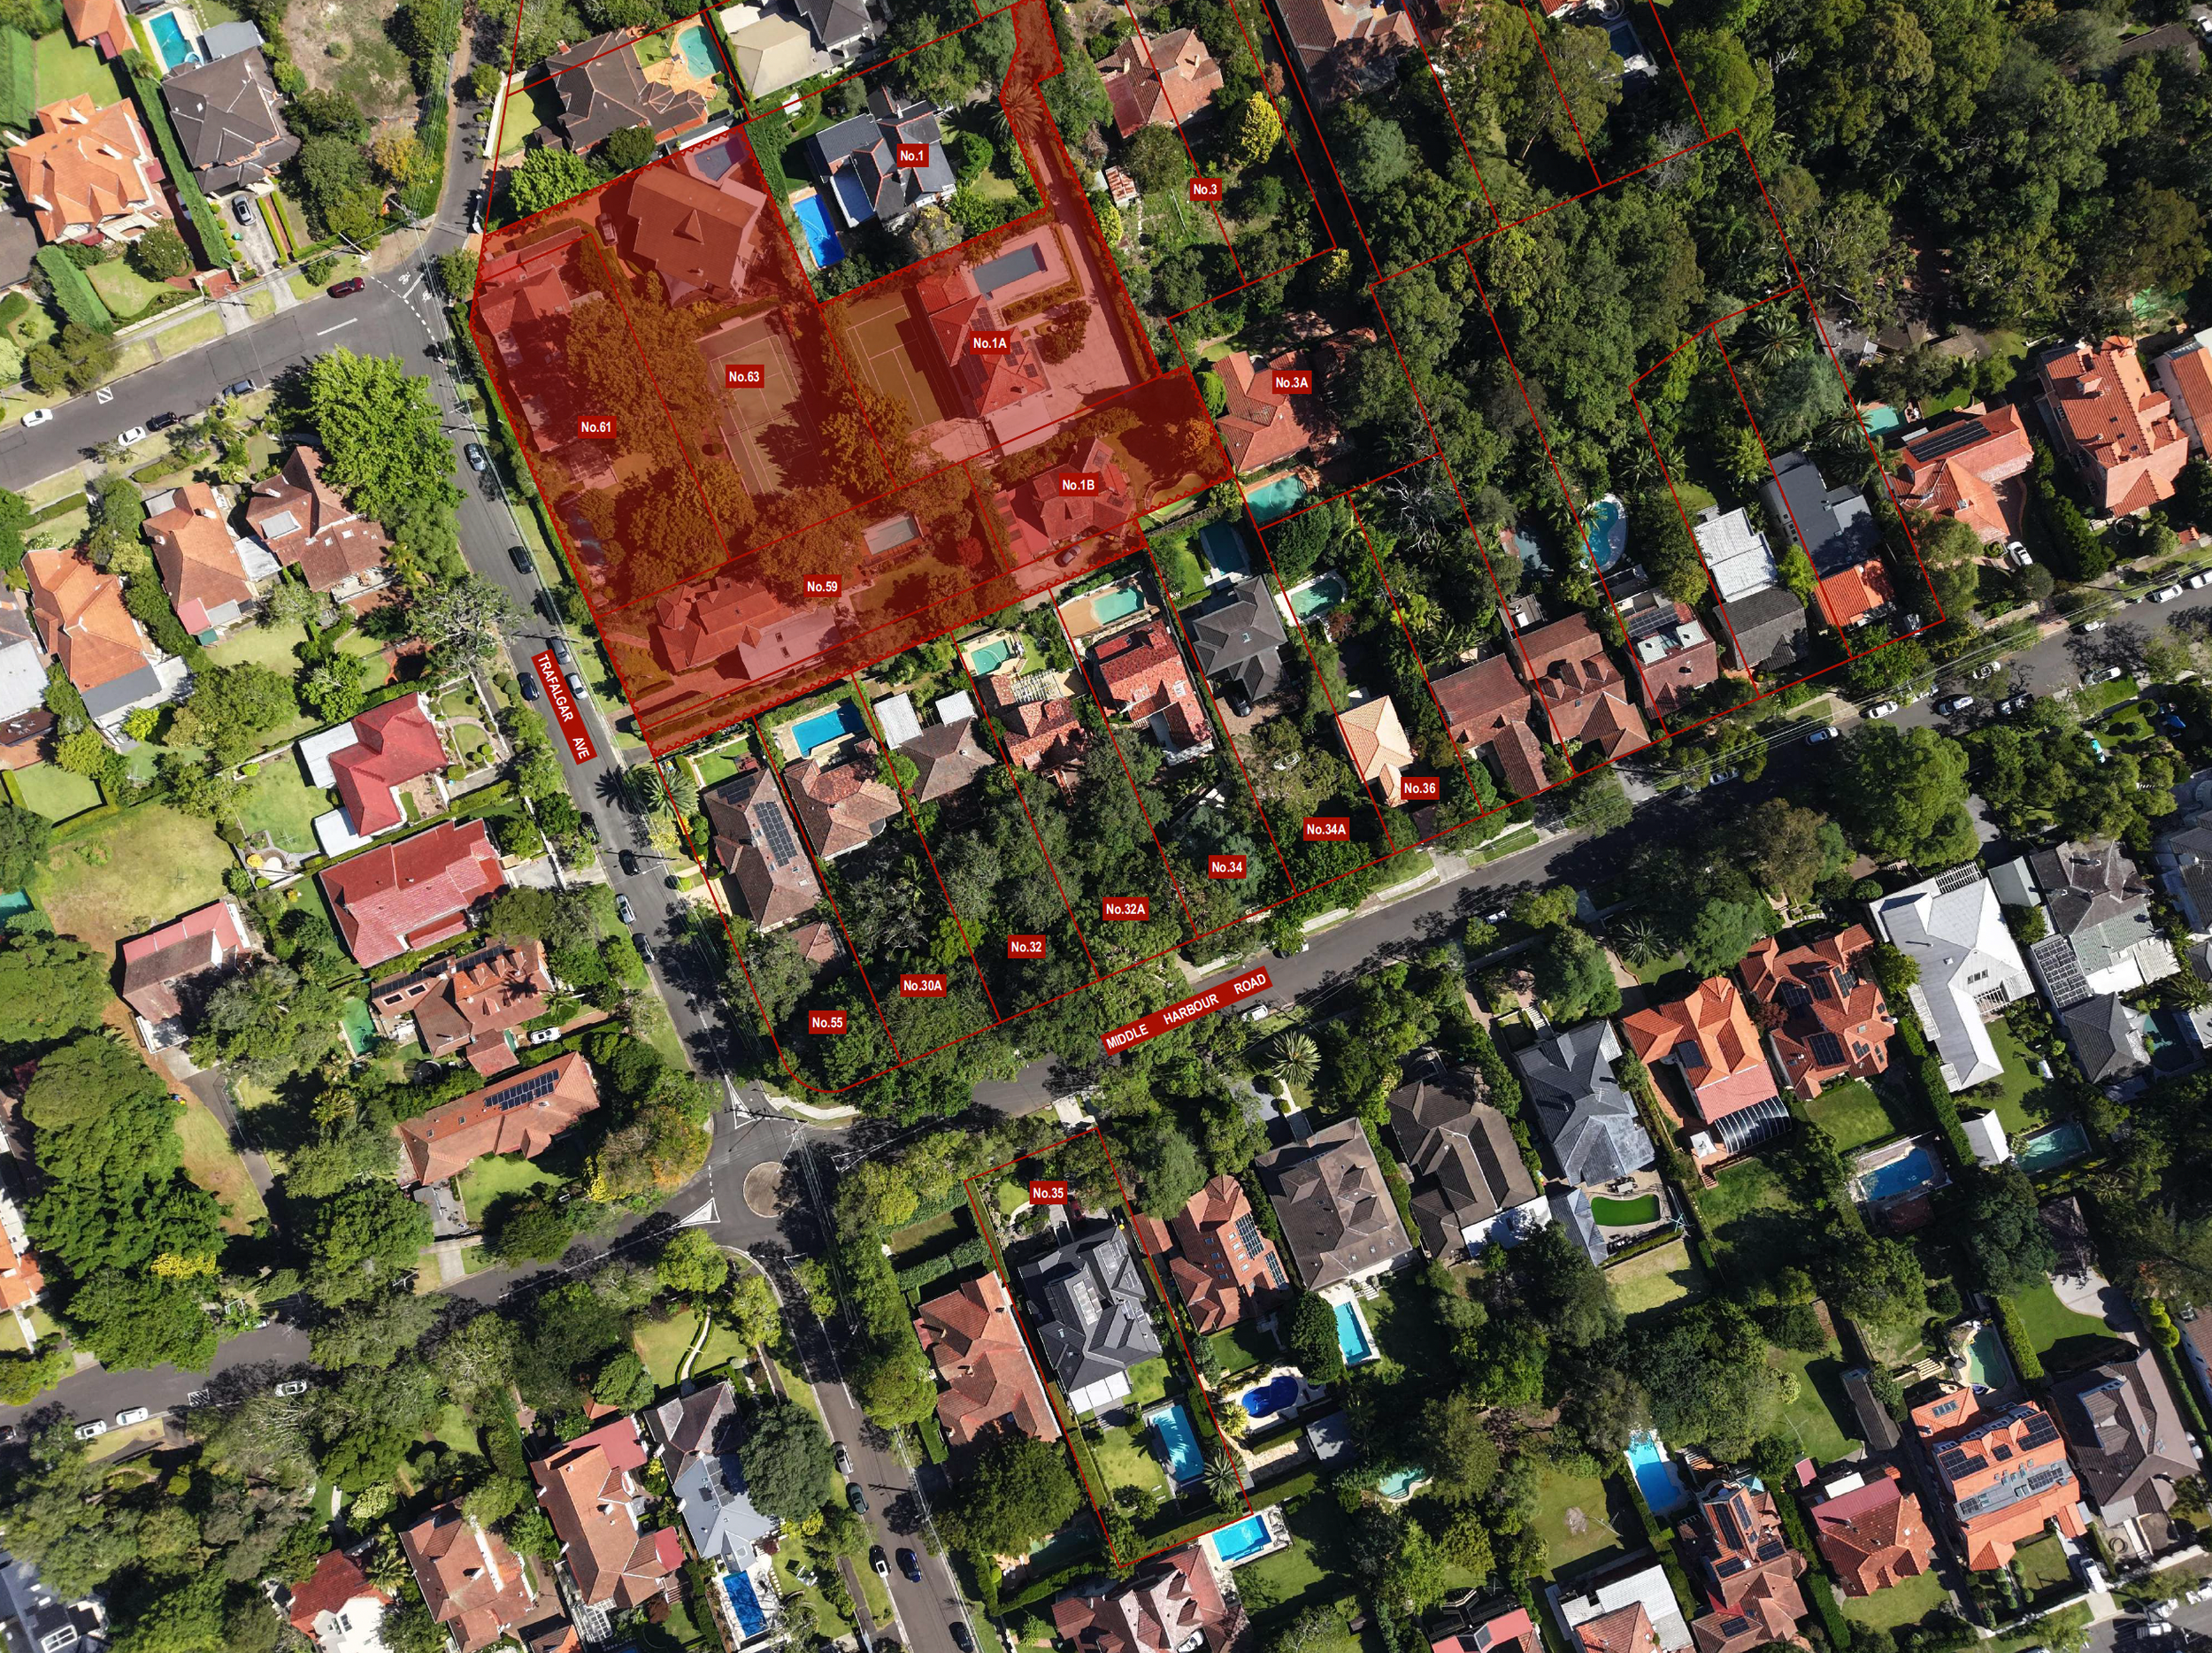
One of the key uses of shadow diagrams is to assess solar access for neighbouring buildings and nearby public spaces, including parks, plazas, and sidewalks. In densely built urban areas, where buildings are closely spaced, limited sunlight can make spaces feel cramped, cold, or gloomy. Shadow diagrams help architects, urban planners, and developers determine whether a proposed building might reduce sunlight below the minimum levels required by building codes. These regulations often specify the amount of sunlight that certain properties and public areas must receive, especially during winter months when sunlight is limited. If a new development is likely to cast significant shadows that affect these requirements, development applications may include conditions or require revisions to minimise overshadowing and ensure compliance with solar access standards.
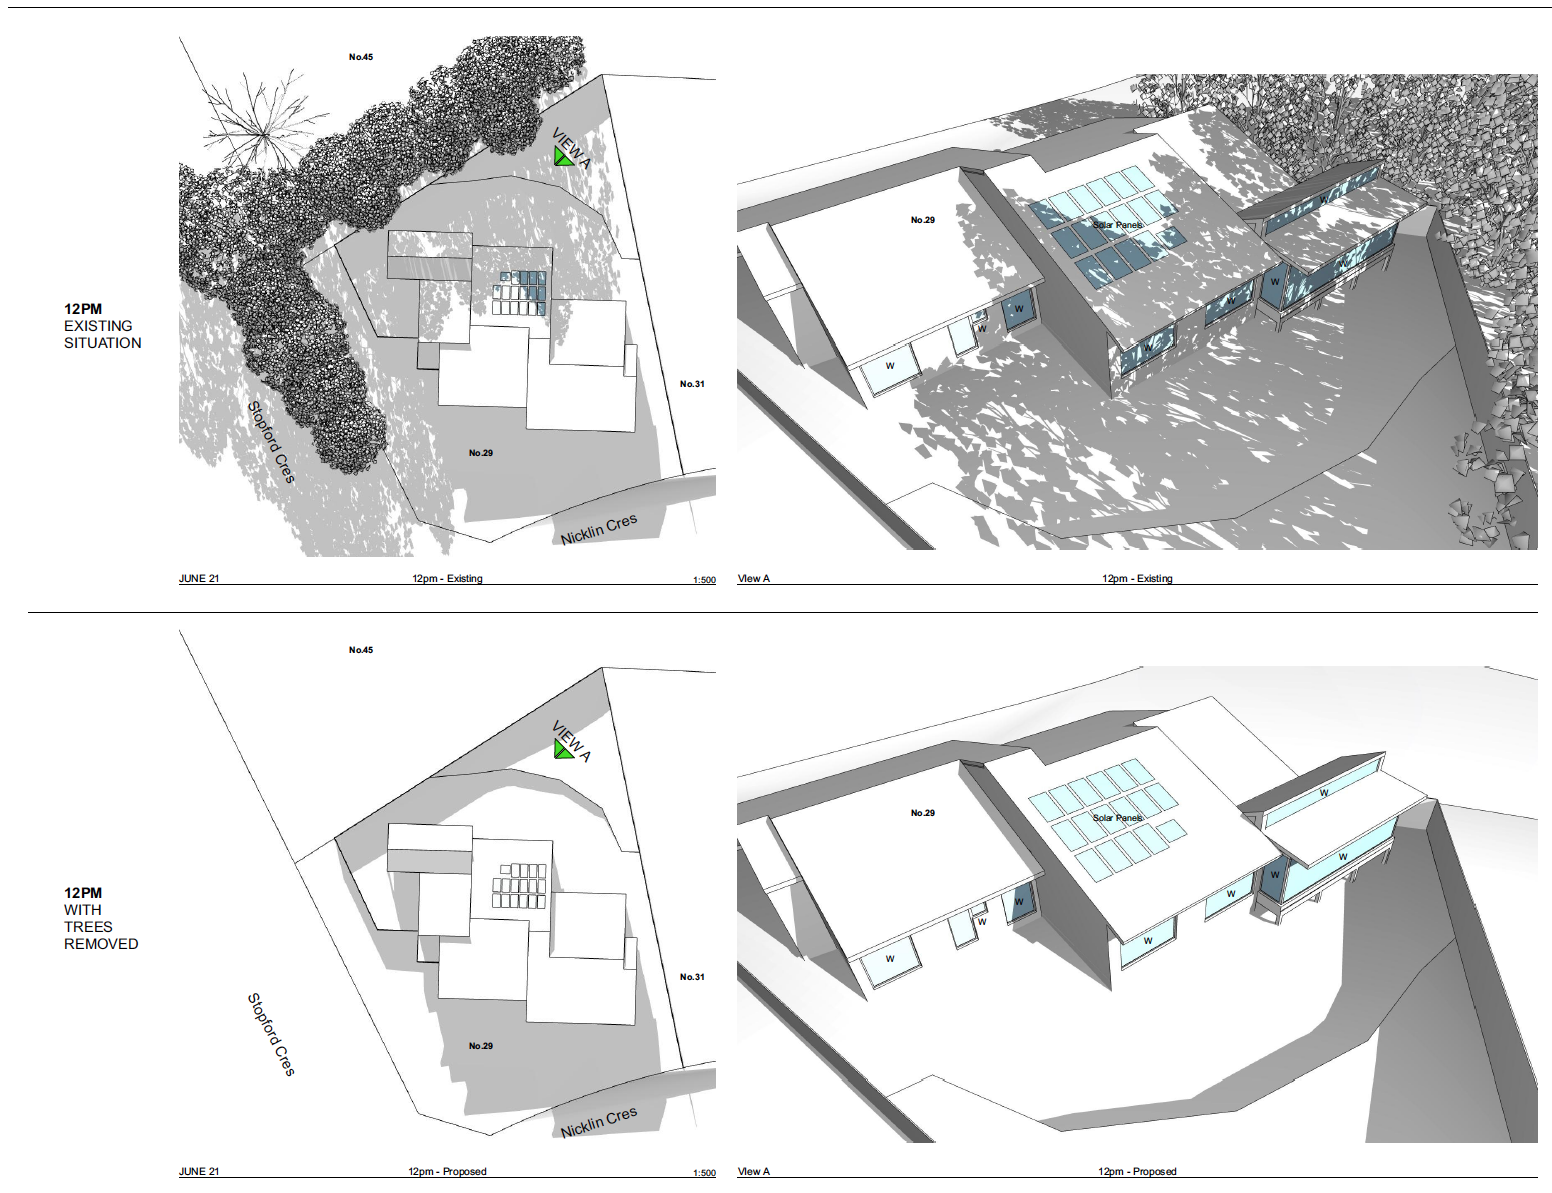
Shadow diagrams are also essential for protecting solar rights, which play a critical role in improving energy efficiency in buildings. With rooftop solar panels increasingly installed in residential and commercial properties across Sydney, Melbourne, and other Australian cities, maintaining uninterrupted sunlight has become more important than ever. Overshadowing from new developments can significantly reduce the energy output of solar installations, affecting both sustainability goals and long-term energy efficiency. By identifying potential shading issues early in the design process, architects and urban planners can adjust building orientation, height, or facade design to ensure new developments coexist harmoniously with surrounding properties while maximising sunlight access for solar panels.

Shadow diagrams are an essential part of development applications submitted to councils in Sydney, Melbourne, and across Australia. Planning authorities often have strict guidelines on overshadowing, especially in residential zones where access to sunlight is considered a key right. Excessive shadowing can result in community objections, project delays, or refusal of approval, making accurate shadow impact assessments critical for architects and developers. By using shadow diagrams, development teams can evaluate how a proposed building affects neighbouring properties and public spaces, and make informed adjustments to building setbacks, height, or footprint. This ensures compliance with local planning regulations, minimises overshadowing, and helps maintain positive relations with the community.

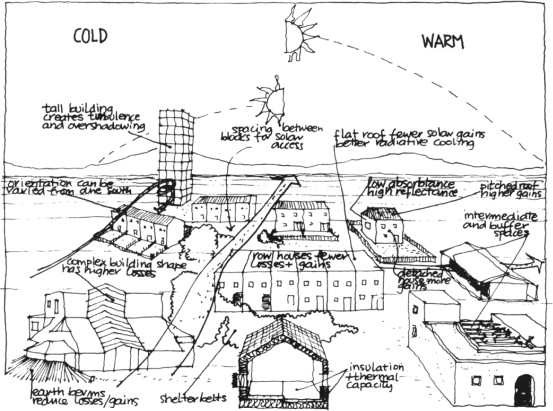
Beyond regulatory compliance, shadow diagrams play a key role in supporting sustainable urban development across Sydney, Melbourne, and other Australian cities. As urban areas strive to become more vibrant, livable, and environmentally responsible, careful planning of sunlight and shading helps create healthier urban environments. Proper access to natural light reduces reliance on artificial lighting and heating, particularly during winter months, lowering energy consumption and greenhouse gas emissions. By using shadow diagrams effectively, architects and urban planners can design buildings and public spaces that are energy-efficient, functional, and human-centric, contributing to broader sustainable development goals.
Shadow diagrams are more than technical drawings—they bridge the gap between a building’s functional requirements and its social and environmental responsibilities. They enable architects to design structures that respect surrounding properties, enhance urban liveability, and integrate harmoniously into the existing cityscape. By assessing sunlight and shadow impacts, these diagrams help ensure that new developments support sustainable, balanced, and responsible urban growth, making them an indispensable tool in contemporary architectural and urban planning practice.

Key Components of a Shadow Diagram
Shadow diagrams are essential tools for architects, urban planners, and developers to evaluate sunlight access, shading, and solar impacts on buildings and public spaces. The critical components of a shadow diagram include:
Location and Orientation: Each shadow diagram is specific to a site’s geographical coordinates (latitude and longitude) and orientation (azimuth), ensuring accurate representation of sun and shadow movement.
Time Scale: Shadow diagrams can be prepared for daily or annual time frames. Daily diagrams show shadow changes throughout a single day, while annual diagrams illustrate seasonal variations in sunlight and shading.
Solar Position: The sun’s path is mapped in the diagram, showing solar altitude (angle above the horizon) and azimuth (position along the horizon) at different times of day or year.
Objects and Shadows: Buildings, trees, and other structures are represented, with their shadows cast on the diagram to show how shadow length and direction change as the sun moves.
Key Times: Critical times, such as sunrise, solar noon, and sunset, are highlighted to show when shadows are longest or shortest.
Annotations: Labels and notations indicate shadow lengths, angles, and times for precise analysis.
Applications of Shadow Diagrams
Architects, urban planners, and developers use shadow diagrams to inform key design and planning decisions, including:
Daylighting: Optimising natural light inside buildings to reduce reliance on artificial lighting and improve energy efficiency.
Solar Gain and Passive Heating: Assessing how sunlight affects heating and cooling needs.
Outdoor Space Design: Designing gardens, terraces, and public areas to balance shade in summer with sunlight in winter.
Urban Planning: Evaluating the impact of new developments on neighbouring properties, streets, and public spaces.
Solar Panel Placement: Identifying optimal locations for solar panels to maximise energy generation.
By using shadow diagrams, designers can create buildings and urban spaces that are energy-efficient, functional, and sensitive to their surroundings, ensuring compliance with planning regulations and promoting sustainable urban development.

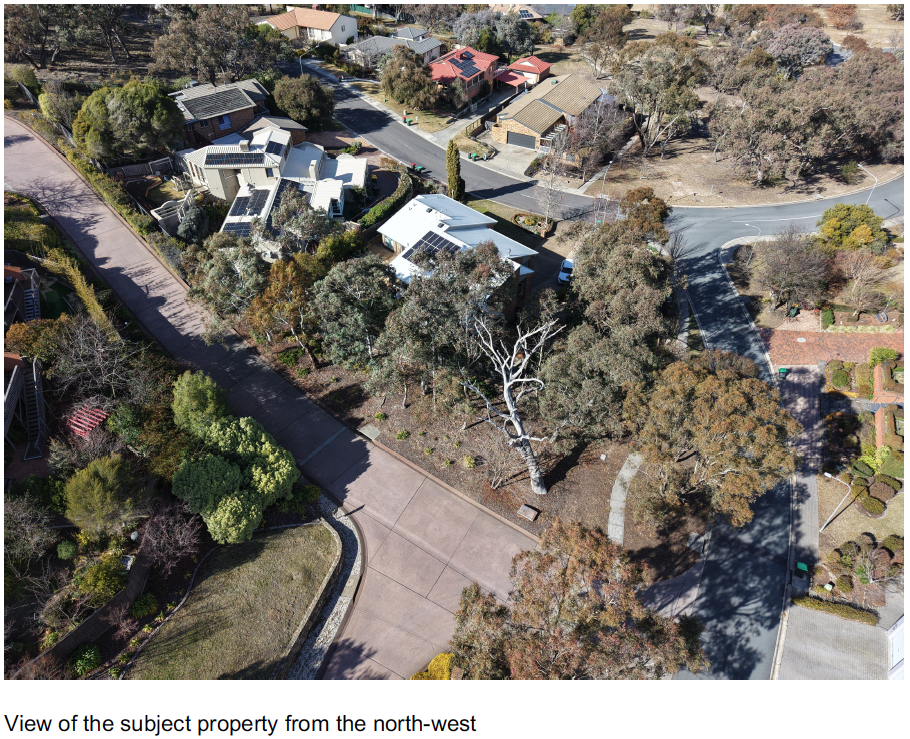
Tree Overshadowing Diagrams - Animation